This WP aim to analyse and quantify mechanisms contributing to changes in the hydrological cycle and energy balance of the key region.
1 Quantify atmospheric heat and moisture transport and oceanic heat transport and their effects on the sea ice, ocean salinity and precipitation in the key region
2. Quantify the hydrological response in the key region to large-scale atmospheric conditions.
The Arctic region is warming at a higher rate than the rest of the globe. In the Arctic, the highest warming is found close to the surface from October to April. A higher input of energy compared to loss processes (e.g. outgoing long wave radiation) leads to this warming. In order to quantify the different energy pathways, WP2 looks into energy import via the ocean and atmosphere, both as seen in meteorological reanalysis project (ECMWF) as well as in climate models (e.g. NorESM). In order to investigate the atmospheric energy transport, a Lagrangian particle transport model is used to track the transport of different components of the energy budget.
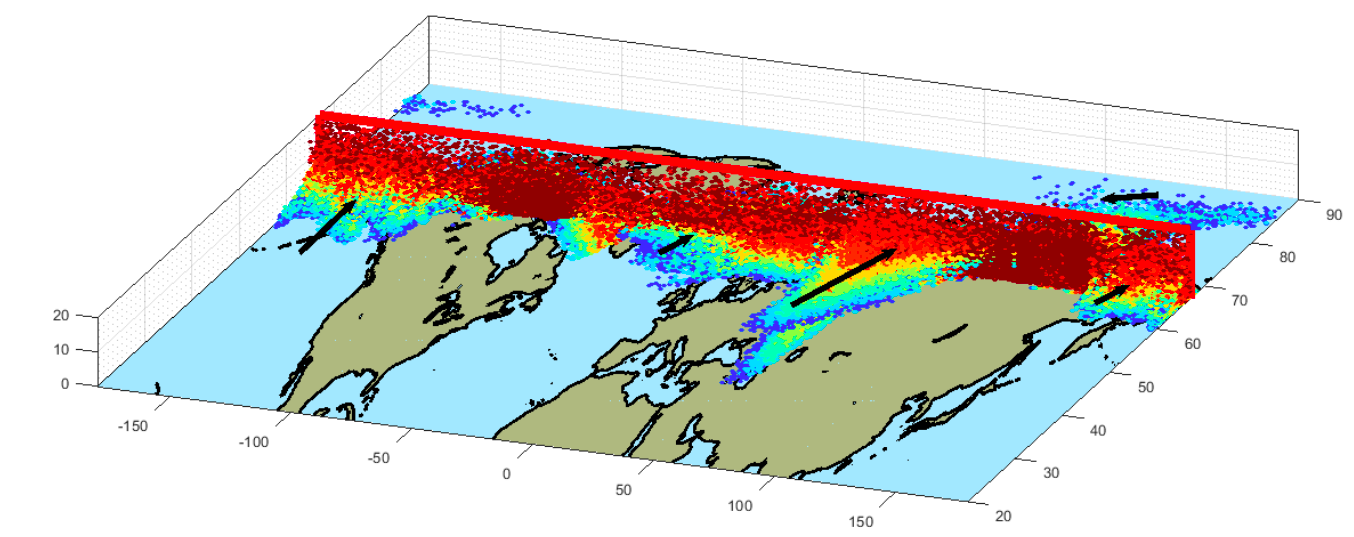
Climate warming also has an impact on the high latitude hydrology. We analyse main structures of atmospheric water transport, called atmospheric rivers, look at changing precipitation patterns and analyse the development of the Greenland ice sheet. In general annual average precipitation over Norway exhibits a decreasing trend, however extreme events (either droughts or precipitation) are likely to occur more frequently. Observed extreme precipitation events in Norway are most often associated with atmospheric rivers in the regions with largest mean daily precipitation or 99.5th percentile of daily precipitation. In Southern Norway, the atmospheric circulation during those events is dominated by a cyclonic circulation whereas it is dominated by a dipole of cyclonic to the north and anticyclonic anomalies to the south for events occurring along the western coast of Norway. The season at which most extremes occur can shift from fall to winter or from summer to fall when they are linked to atmospheric rivers. Not only the atmospheric part, but also ocean flow and the Greenland ice sheet which have both an important role in the Arctic climate are analysed.